Investors
Factsheet
Companies
Ventures
Corticeira Amorim
Tracing its roots back to the 19th century, Amorim has become the world’s largest cork and cork-derived company in the world, generating more than Euro 1,021 million in sales to more than 100 countries through a network of dozens of fully owned subsidiaries.
With a multi-million Euro R&D investment per year, Amorim has applied its specialist knowledge to this centuries-old traditional culture, developing a vast portfolio of 100% sustainable products that are used by blue-chip clients in industries as diverse and demanding as wines & spirits, aerospace, automotive, construction, sports, interior and fashion design.
Amorim’s responsible approach to raw materials and sustainable production illustrates the remarkable interdependence between industry and a vital ecosystem - one of the world’s most balanced examples of social, economic and environmental development.
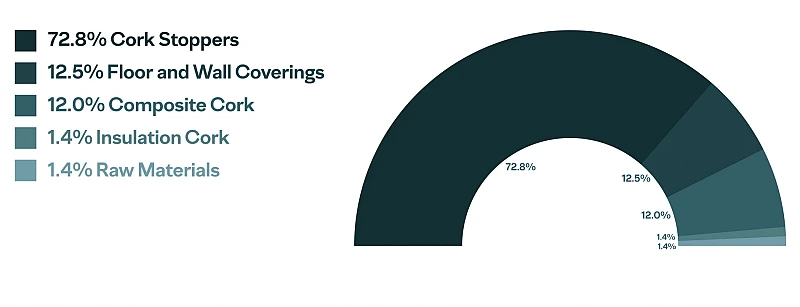
Sales by Business Unit (2022)
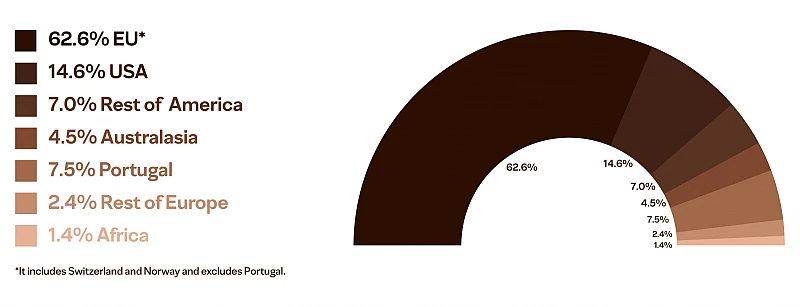
Sales by Geographical Area (2022)
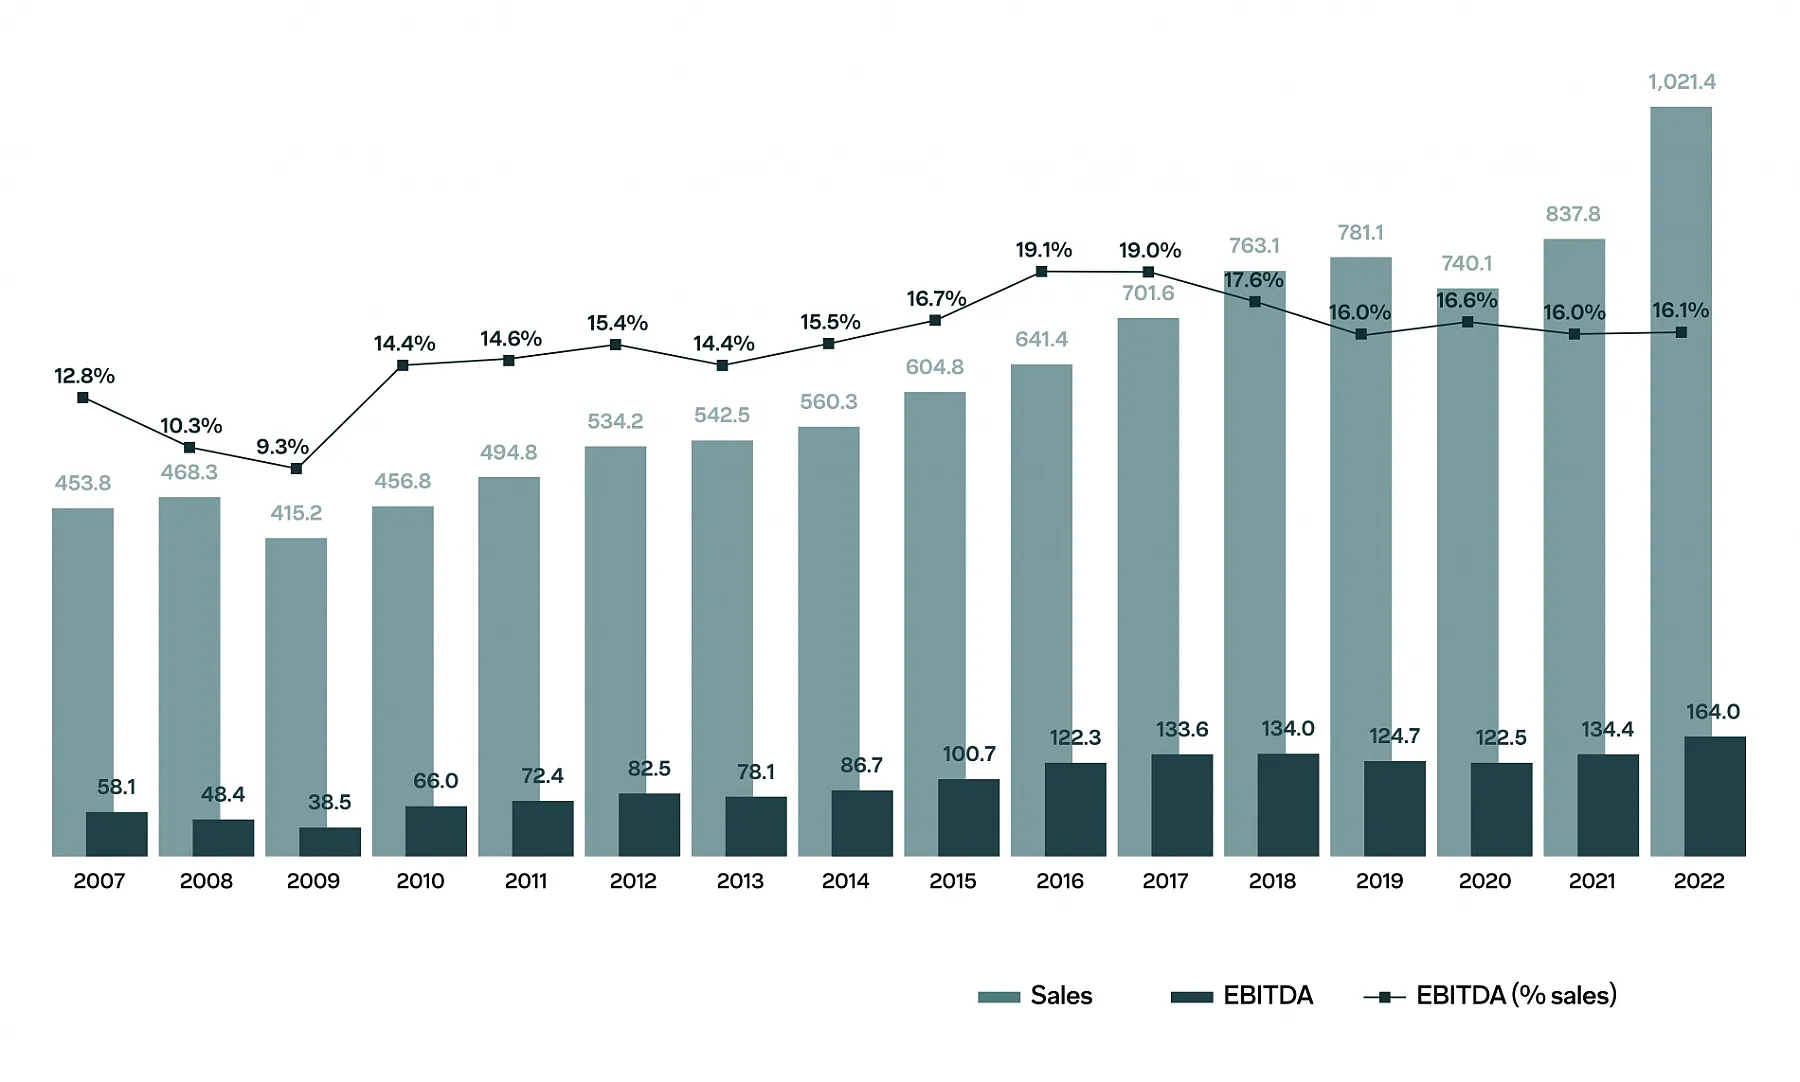
Sales| EBITDA | Margin EBITDA / Sales (2022)
Key Figures
| Income Statement | Unit | 2022 | 2021 | 2020 | 2019 | 2018 |
|---|---|---|---|---|---|---|
| Sales | M€ | 1021,4 | 837,8 | 740,1 | 781,1 | 763,1 |
| Gross Margin | M€ | 523,8 | 415,8 | 386,5 | 387,4 | 386,5 |
| Gross Margin / Sales | % | 51,3 | 49,6 | 52,2 | 49,6 | 50,6 |
| External Supplies | M€ | 186,5 | 142,6 | 123,2 | 124,8 | 124,1 |
| Staff Costs | M€ | 182,9 | 146,1 | 138,1 | 139,9 | 134,2 |
| Other Operating Costs (includes depreciation) | M€ | 39,0 | 33,5 | 29,1 | 33,1 | 25,5 |
| EBITDA | M€ | 164,0 | 134,4 | 122,5 | 124,7 | 134,0 |
| EBITDA / Sales | % | 16,1 | 16,0 | 16,6 | 16,0 | 17,6 |
| EBIT | M€ | 115,3 | 93,7 | 86,0 | 89,5 | 102,7 |
| Net Income | M€ | 98,4 | 74,8 | 64,3 | 74,9 | 77,4 |
| Consolidated Statment of Financial Position | Unit | 2022 | 2021 | 2020 | 2019 | 2018 |
|---|---|---|---|---|---|---|
| Net Goodwill | M€ | 18,9 | 9,8 | 13,7 | 13,7 | 14,0 |
| Net Fixed Assets / Intangible Assets / Rights of Use | M€ | 420,1 | 307,4 | 304,1 | 295,5 | 267,2 |
| Net Working Capital * | M€ | 441,8 | 358,3 | 407,7 | 427,4 | 414,5 |
| Other ** | M€ | 46,2 | 61,3 | 31,0 | 28,6 | 13,7 |
| Invested Capital | M€ | 926,9 | 736,8 | 756,5 | 765,3 | 709,4 |
| Net Debt | M€ | 129,0 | 48,07 | 110,7 | 161,1 | 139,0 |
| Share Capital | M€ | 133,0 | 133,0 | 133,0 | 133,0 | 133,0 |
| Reserves and Retained Earnings | M€ | 532,6 | 462,9 | 416,7 | 376,5 | 333,4 |
| Non Controlling Interests | M€ | 79,3 | 27,3 | 26,9 | 30,1 | 31,9 |
| Agreement to Acquire Non-controlling Interests | M€ | 0,0 | 5,0 | 10,0 | 15,0 | 20,4 |
| Taxes and Deferred Taxes | M€ | 25,1 | 33,3 | 32,2 | 26,1 | -12,6 |
| Provisions | M€ | 6,6 | 5,5 | 4,5 | 5,5 | 43,4 |
| Grants *** | M€ | 21,3 | 21,7 | 21,0 | 18,1 | 21,3 |
| Equity and Other Sources | M€ | 767,9 | 688,8 | 644,4 | 604,2 | 570,7 |
* Inventories + Accounts receivables - Accounts payables + Other operating assets/(liabilities)
** Investment property + Investments in associates + Intangible assets + Other non-operating assets/(liabilities)
*** Non interest bearing grants (reimbursable and non-reimbursable)
| Data per share | Unit | 2022 | 2021 | 2020 | 2019 | 2018 |
|---|---|---|---|---|---|---|
| Number of shares | shares | 133.000.000 | 133.000.000 | 133.000.000 | 133.000.000 | 133.000.000 |
| Earnings per share | € | 0,740 | 0,562 | 0,484 | 0,564 | 0,582 |
| Book value per share | € | 5,601 | 4,686 | 4,336 | 4,057 | 3,746 |
| Share price (period-end) | € | 8,720 | 11,28 | 11,60 | 11,30 | 9,000 |
| Market Capitalisation (period-end) | M€ | 1.159,8 | 1.500,2 | 1.542,8 | 1.502,9 | 1.197,0 |
| Dívida & Rácios | Unit | 2022 | 2021 | 2020 | 2019 | 2018 |
|---|---|---|---|---|---|---|
| Net Debt | M€ | 129,0 | 48,07 | 110,7 | 161,1 | 139,0 |
| Net Debt/EBITDA | X | 0,79 | 0,36 | 0,90 | 1,29 | 1,04 |
| EBITDA/Net Interest | X | 148,6 | 167,7 | 105,7 | 88,2 | 108,0 |
| Gearing | % | 17,3 | 7,7 | 19,2 | 29,9 | 27,9 |
| Net Working Capital (NWC) | M€ | 441,8 | 358,3 | 407,7 | 427,4 | 414,5 |
| NWC / Market Capitalization | % | 38,1 | 26,4 | 26,4 | 28,4 | 34,6 |
| NWC / Sales x 360 | X | 109,3 | 154,0 | 197,8 | 197,0 | 195,5 |
| Free Cash Flow (FCF) | M€ | 139,6 | 119,2 | 90,0 | 37,5 | 11,2 |
| Capex | M€ | 76,7 | 44,0 | 44,8 | 58,8 | 57,9 |
| Return on Invested Capital (ROIC) | % | 11,8 | 10,2 | 9,8 | 10,8 | 11,8 |
| Average cost of debt | % | 1,2 | 0,9 | 1,0 | 1,14 | 1,09 |
Net Debt/EBITDA considering the EBITDA of the last four quarters
NWC = Inventories + Trade receivables + Other operating assets - Trade payables - Other operating liabilities
FCF = EBITDA - Non-current cash expenditures - Net financing expenses - Income tax - Capex - NWC variation
Analyst Coverage
| Entity | Analyst | Price-Target | Recommendation | Date |
|---|---|---|---|---|
| Santander |
Manuel Lorente
manuel.lorente@gruposantander.com
|
11,75 | Outperform | 2024-03-19 |
| Berenberg |
Fraser Donlon
fraser.donlon@berenberg.com
|
12,00 | Buy | 2024-03-04 |
| JB Capital Markets |
Enrique Parrondo Navarro
eparrondo@jbcapital.com
|
12,50 | Buy | 2024-02-26 |
| Caixa BI |
Carlos Jesus
carlos.jesus@caixabi.pt
|
12,20 | Buy | 2024-02-06 |
| ODDO BHF |
Luis de Toledo Heras
luis.de-toledo-heras@oddo-bhf.com
|
11,50 | Outperform | 2024-01-26 |
| CaixaBank BPI |
Bruno Bessa
bruno.bessa@caixabank.com
|
11,60 | Buy | 2024-01-22 |
| A|S Independent Research |
António Seladas, CFA
aseladas@asindependentresearch.com
|
9,50 | Neutral | 2023-12-28 |
| Renta 4 |
Pablo Fernández de Mosteyrín
pablofernandez@renta4.es
|
11,50 | Sobreponderar | 2023-12-13 |
| Bestinver Securities |
Enrique Yáguez, CFA
eyaguez@bestinver.es.
|
10,50 - 11,80 | Hold | 2023-04-28 |